Project Ascend: The $1B+ Location Decision
How we guided a Fortune 500 semiconductor manufacturer through a multi-state, billion-dollar site selection using integrated 15-year NPV modeling, workforce sustainability scoring, and government engagement evaluation across 8 competing markets.
01. Executive Summary & Client Challenge
The Client
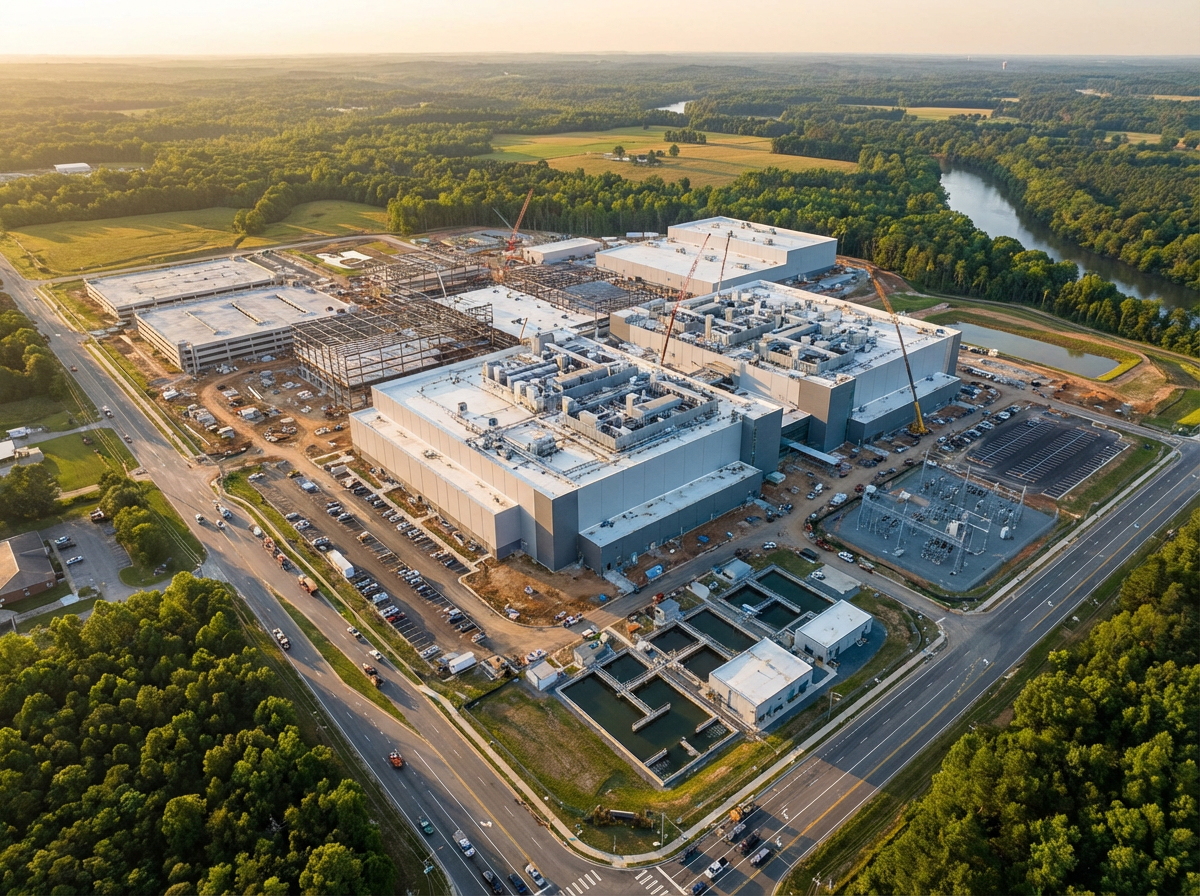
A Fortune 500 semiconductor manufacturer and global leader in advanced memory chip production faced a strategic imperative: identify the optimal U.S. location for a next-generation fabrication facility representing over $1 billion in capital investment. The project would require 60+ acres of industrial land, employ hundreds of highly specialized technical workers, and operate for decades as a cornerstone of the company's North American manufacturing footprint.
The Strategic Context
This wasn't a routine expansion. The client was navigating:
- Geopolitical supply chain pressures driving reshoring of semiconductor manufacturing to the United States
- Federal CHIPS Act incentives creating a narrow window for optimized site selection and funding capture
- Intense competition for technical talent in a labor market where semiconductor engineers and cleanroom operators are in critically short supply
- 15-year operational horizon requiring long-term cost predictability, workforce sustainability, and utility infrastructure resilience
The Challenge
The client had identified eight candidate markets across seven states, spanning the Sunbelt, Midwest, and Pacific Northwest. Each market presented trade-offs:
Sunbelt Markets
Favorable construction and labor costs but raised questions about workforce depth and utility capacity for a water- and energy-intensive fab.
Coastal Markets
Deep technical talent pools but threatened to erode ROI through elevated land, construction, and ongoing operational expenses.
Midwest Hubs
Balanced cost and workforce but varied wildly in government engagement quality and incentive competitiveness.
Traditional site selection approaches — cost-only models or incentive-chasing — would fail to capture the nuanced, long-term trade-offs. The client engaged Hyphen Strategies to deliver an integrated analysis answering three questions simultaneously: true 15-year cost, workforce sustainability, and government partnership readiness.
02. Methodology & Analytical Framework
Hyphen Strategies designed a proprietary analytical framework that went far beyond traditional site selection scorecards. We built an integrated financial and qualitative model that evaluated each market across four dimensions — then synthesized them into a single directional visualization.
Capital Expenditure Analysis
Land acquisition and construction cost indexing across all 8 MSAs using national cost data and regional multipliers.
15-Year NPV Operational Cost
Labor, utilities (electric, gas, water, wastewater), and taxation modeled over a 15-year net present value horizon.
Workforce Quality & Sustainability
Technical talent supply, wage competitiveness, workforce sustainability, educational pipeline, and union exposure risk.
Government Engagement & Incentives
State and local partnership readiness, incentive value, political risk, administrative capacity, and track record of execution.
Dual-Sector Insight as Competitive Advantage
This project showcased Hyphen Strategies' unique value proposition: dual fluency in corporate site selection and public-sector economic development.
Corporate Perspective
We understood the client's need for cost predictability, workforce risk mitigation, and operational flexibility over a 15-year horizon.
Public-Sector Perspective
We knew how to evaluate government engagement quality — not just incentive dollar amounts, but the political will, administrative capacity, and track record of delivering on commitments at this scale.
That dual perspective allowed us to flag risks that pure-play corporate consultants miss (e.g., markets with generous incentive statutes but weak execution track records) and opportunities that public-sector-only advisors overlook (e.g., markets where labor cost savings compound dramatically over 15 years despite modest incentive packages).
03. Aggregate Cost Analysis (15-Year NPV)
We calculated the total 15-year net present value cost for each market, integrating land acquisition, construction (indexed to local conditions), labor, utilities, and taxation. The cost spread across markets was dramatic.
15-Year Aggregate Cost by Market ($ Billions)
Directional estimates based on integrated financial model. Actual figures anonymized.
Largest single cost factor across all markets
Second-largest factor — underscoring workforce importance
Land acquisition is a minor factor in most markets
Key Insight
The highest-cost market (Seattle/Tacoma at $2.48B) was nearly double the lowest-cost markets. But cost alone doesn't tell the full story — the cheapest market isn't necessarily the best long-term value when workforce sustainability and government partnership quality are factored in.
04. Workforce Quality & Sustainability
We evaluated each market's labor pool across multiple dimensions: technical talent supply, wage competitiveness, workforce sustainability (educational pipeline, retention risk, demographic trends), and union exposure risk.
Labor Cost vs. Qualitative Performance
Key Workforce Findings
- ⚠️Columbus, OH and Ann Arbor, MI scored lower on workforce sustainability despite moderate costs — raising long-term retention and pipeline concerns.
- 🔴Seattle/Tacoma, WA and Ann Arbor, MI exhibited elevated union exposure risk — a critical consideration for a non-union client.
- ✅Phoenix, AZ, Indianapolis, IN, and Columbus, OH offered the most favorable labor cost profiles, but Phoenix significantly outperformed on qualitative metrics.
- 💰Austin, TX and Seattle/Tacoma, WA had the highest employee cost compared to other markets.
Critical Distinction
Workforce analysis must go beyond wage rates to assess sustainability and risk. Technical talent supply, educational pipeline, retention trends, and union exposure are make-or-break variables for advanced manufacturing.
05. Government Engagement & Incentives
We assessed each state and local government's partnership readiness and incentive competitiveness, integrating incentive value, government engagement quality, and tax burden into a comprehensive evaluation.
Government Engagement Rating by Market
Engagement score reflects responsiveness, track record, political alignment, and administrative capacity.
Incentive Landscape
- The highest absolute incentive values were offered by Indiana, Michigan, and Arizona.
- Georgia and North Carolina offered lower incentive values — but had the strongest government engagement ratings, suggesting confidence in their competitive position.
- The highest rough tax obligations were in Ohio and Indiana; however, these were expected to drop significantly after adjustments.
- The lowest rough tax obligations were in North Carolina and Washington.
The Incentive Paradox
States that offer the largest incentive packages are often compensating for competitive weaknesses. States with strong fundamentals (cost, workforce, infrastructure) can afford to offer smaller incentives — and are often better long-term partners because they're not over-promising to win a deal.
Georgia and Ohio had the worst incentive-to-tax ratios, while Michigan, Indiana (West Lafayette), and Arizona had the best.
06. Integrated Directional Analysis
We synthesized all variables into a single directional framework showing the intersection of total 15-year cost (x-axis), labor composite score (y-axis), and government engagement rating (bubble size). This created two clear quadrants.
High-Performing Quadrant
Lower cost, stronger workforce, better government engagement
Top-tier government engagement with competitive cost-labor balance
Lowest cost combined with top government engagement — strongest overall position
Strong labor performance with favorable cost and solid engagement
Low-Performing Quadrant
Higher cost, weaker workforce, lower government engagement
Lower labor scores and government engagement — one of the lowest performers
Prohibitively high costs ($2.48B) despite strong workforce — off the chart
Middle-Tier Markets
Competitive cost with strong incentive value but moderate labor scores
Lowest aggregate cost but smaller market with moderate engagement
The Verdict
Georgia (Atlanta) and North Carolina (Raleigh) occupied the high-performing quadrant, combining competitive costs, strong workforce metrics, and top-tier government engagement. These markets emerged as the clear frontrunners for long-term value — not because they were the cheapest, but because they offered the best risk-adjusted combination of all three critical variables.
07. Outcomes & Client Value
What We Delivered
Clear Directional Guidance
Identified Georgia (Atlanta) and North Carolina (Raleigh) as the top-performing markets for long-term value — combining competitive costs, strong workforce metrics, and top-tier government engagement.
Risk Mitigation Intelligence
Flagged workforce sustainability concerns in Ohio and Michigan, union exposure risk in Washington and Michigan, and cost outliers in Seattle/Tacoma — before the client invested in site visits.
Negotiation Leverage
Transparent, data-driven cost and incentive benchmarking allowed the client to engage state and local partners from a position of informed confidence.
Decision-Making Confidence
Synthesized complex, multi-variable trade-offs into a single, defensible analytical framework the board could approve under scrutiny.
Quantifiable Impact
Avoided Cost Exposure
By ruling out Seattle/Tacoma early, the client avoided a market where 15-year costs were $1+ billion higher than competitive alternatives.
Workforce Risk Mitigation
Surfaced labor sustainability concerns in Columbus and Ann Arbor, avoiding markets where long-term talent retention could threaten operational continuity.
Incentive Optimization
Benchmarked incentive value across all markets, enabling the client to enter negotiations with realistic expectations and data to support enhanced packages.
“The client's decision to move forward with the recommended market validated our directional analysis and underscored the value of integrated, long-horizon modeling for capital-intensive manufacturing projects.”
08. Lessons Learned & Transferable Insights
Every major engagement produces insights that extend beyond the specific project. Here are the strategic takeaways from Project Ascend that apply to any capital-intensive site selection.
The Lowest-Cost Market Is Rarely the Best Long-Term Value
Cost matters — but workforce sustainability, utility infrastructure resilience, and government partnership quality matter more. A market that saves $50M on construction but loses $200M over 15 years due to labor turnover, utility constraints, or failed incentive delivery is a bad deal.
Workforce Analysis Must Go Beyond Wage Rates
Technical talent supply, educational pipeline, retention trends, and union exposure are make-or-break variables for advanced manufacturing. Markets with low wages but weak workforce sustainability are false economies.
Government Engagement Quality ≠ Incentive Dollar Amounts
States that offer the largest incentive packages are often compensating for competitive weaknesses. States with strong fundamentals can afford to offer smaller incentives — and are often better long-term partners because they're not over-promising to win a deal.
Integrated Modeling Is Essential for Complex Decisions
Separate cost models, workforce reports, and incentive summaries force clients to synthesize conflicting data themselves — introducing bias, error, and decision paralysis. An integrated framework produces faster, more defensible decisions.
Dual-Sector Expertise Is a Competitive Advantage
Understanding both the corporate client's operational priorities and the public-sector partner's political and administrative constraints allows for more accurate risk assessment, more realistic incentive expectations, and more durable long-term relationships.
Evaluating a Major Facility Decision?
Our integrated methodology — combining 15-year NPV financial modeling, workforce sustainability scoring, and government engagement evaluation — delivers clear directional guidance that de-risks decisions and positions clients for successful negotiation.
Start a ConversationCase Study. Client details anonymized. For discussion purposes only.